Index Trend Analysis Report
Prepared for you on Friday, July 26, 2024.
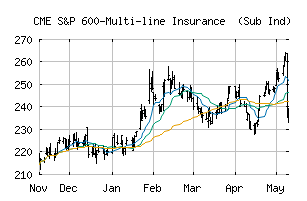
S&P 600-Multi-line Insurance (Sub Ind) (CME:SP600-40301030)
Sidelines Mode (+55) - SP600-40301030 is moving in a sideways pattern and is unable to gain momentum in either direction. Beware of choppy movement and consider a sidelines position until a stronger trend is identified.
Is it time to buy, sell, or avoid SP600-40301030?
MarketClub looks at technical strength and momentum to determine if the timing is right for SP600-40301030.
Learn more about the Trade Triangles and how we make technical analysis as easy as buy and sell.
|
|||||||||||||||
|
|||||||||||||||
MarketClub’s Trade Triangles for SP600-40301030
![]() The long-term trend has been DOWN since May 22nd, 2024 at 227.95
The long-term trend has been DOWN since May 22nd, 2024 at 227.95
![]() The intermediate-term trend has been UP since Jul 12th, 2024 at 226.53
The intermediate-term trend has been UP since Jul 12th, 2024 at 226.53
![]() The short-term trend has been DOWN since Jul 26th, 2024 at 229.16
The short-term trend has been DOWN since Jul 26th, 2024 at 229.16
Smart Scan Analysis for SP600-40301030
Based on our trend formula, SP600-40301030 is rated as a +55 on a scale from -100 (Strong Downtrend) to +100 (Strong Uptrend).
| Open | High | Low | Price | Change |
|---|---|---|---|---|
| 222.90 | 231.85 | 222.19 | 229.49 | -3.30 |
| Prev. Close | Volume | Bid | Ask | Time |
| 232.79 | 545925 | 2024-07-26 16:19:56 |
| 52wk High | 320.54 | 52wk High Date | 2017-12-04 |
| 52wk Low | 251.65 | 52wk Low Date | 2018-10-26 |