Index Trend Analysis Report
Prepared for you on Saturday, March 14, 2026.
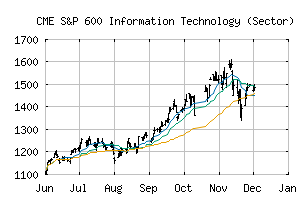
S&P 600 Information Technology (Sector) (CME:SP600-45)
Crossroads (-60) - SP600-45 is struggling to move into a solid trend. Beware of choppy markets and consider a sidelines position until a stronger trend is identified.
Is it time to buy, sell, or avoid SP600-45?
MarketClub looks at technical strength and momentum to determine if the timing is right for SP600-45.
Learn more about the Trade Triangles and how we make technical analysis as easy as buy and sell.
|
|||||||||||||||
|
|||||||||||||||
MarketClub’s Trade Triangles for SP600-45
![]() The long-term trend has been UP since Jun 9th, 2025 at 1171.71
The long-term trend has been UP since Jun 9th, 2025 at 1171.71
![]() The intermediate-term trend has been DOWN since Mar 5th, 2026 at 1585.99
The intermediate-term trend has been DOWN since Mar 5th, 2026 at 1585.99
![]() The short-term trend has been DOWN since Mar 2nd, 2026 at 1614.49
The short-term trend has been DOWN since Mar 2nd, 2026 at 1614.49
Smart Scan Analysis for SP600-45
Based on our trend formula, SP600-45 is rated as a -60 on a scale from -100 (Strong Downtrend) to +100 (Strong Uptrend).
| Open | High | Low | Price | Change |
|---|---|---|---|---|
| 1574.46 | 1592.57 | 1548.67 | 1558.41 | +2.64 |
| Prev. Close | Volume | Bid | Ask | Time |
| 1558.41 | 169961597 | 2026-03-13 16:19:34 |
| 52wk High | 785.11 | 52wk High Date | 2018-08-31 |
| 52wk Low | 622.59 | 52wk Low Date | 2018-02-09 |