Index Trend Analysis Report
Prepared for you on Friday, May 9, 2025.
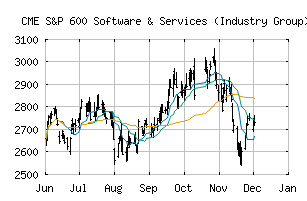
S&P 600 Software & Services (Industry Group) (CME:SP600-4510)
Crossroads (+60) - SP600-4510 is struggling to move into a solid trend. Beware of choppy markets and consider a sidelines position until a stronger trend is identified.
Is it time to buy, sell, or avoid SP600-4510?
MarketClub looks at technical strength and momentum to determine if the timing is right for SP600-4510.
Learn more about the Trade Triangles and how we make technical analysis as easy as buy and sell.
|
|||||||||||||||
|
|||||||||||||||
MarketClub’s Trade Triangles for SP600-4510
![]() The long-term trend has been DOWN since Feb 24th, 2025 at 2781.27
The long-term trend has been DOWN since Feb 24th, 2025 at 2781.27
![]() The intermediate-term trend has been UP since Apr 28th, 2025 at 2526.13
The intermediate-term trend has been UP since Apr 28th, 2025 at 2526.13
![]() The short-term trend has been UP since May 8th, 2025 at 2581.24
The short-term trend has been UP since May 8th, 2025 at 2581.24
Smart Scan Analysis for SP600-4510
Based on our trend formula, SP600-4510 is rated as a +60 on a scale from -100 (Strong Downtrend) to +100 (Strong Uptrend).
| Open | High | Low | Price | Change |
|---|---|---|---|---|
| 2580.98 | 2618.46 | 2563.73 | 2597.73 | +36.36 |
| Prev. Close | Volume | Bid | Ask | Time |
| 2597.73 | 108567271 | 2025-05-08 16:19:11 |
| 52wk High | 2242.84 | 52wk High Date | 2018-09-04 |
| 52wk Low | 1664.92 | 52wk Low Date | 2018-02-09 |