Index Trend Analysis Report
Prepared for you on Saturday, April 4, 2026.
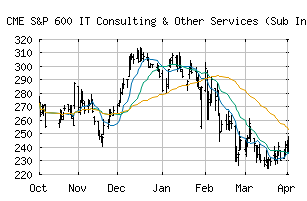
S&P 600 IT Consulting & Other Services (Sub Ind) (CME:SP600-45102010)
Bull Market Weakness (+75) - SP600-45102010 is showing signs of short-term weakness, but still remains in the confines of a long-term uptrend. Keep an eye on SP600-45102010 as it may be in the beginning stages of a reversal.
Is it time to buy, sell, or avoid SP600-45102010?
MarketClub looks at technical strength and momentum to determine if the timing is right for SP600-45102010.
Learn more about the Trade Triangles and how we make technical analysis as easy as buy and sell.
|
|||||||||||||||
|
|||||||||||||||
MarketClub’s Trade Triangles for SP600-45102010
![]() The long-term trend has been DOWN since Feb 23rd, 2026 at 240.41
The long-term trend has been DOWN since Feb 23rd, 2026 at 240.41
![]() The intermediate-term trend has been UP since Apr 2nd, 2026 at 246.48
The intermediate-term trend has been UP since Apr 2nd, 2026 at 246.48
![]() The short-term trend has been UP since Mar 23rd, 2026 at 232.36
The short-term trend has been UP since Mar 23rd, 2026 at 232.36
Smart Scan Analysis for SP600-45102010
Based on our trend formula, SP600-45102010 is rated as a +70 on a scale from -100 (Strong Downtrend) to +100 (Strong Uptrend).
| Open | High | Low | Price | Change |
|---|---|---|---|---|
| 237.57 | 247.78 | 235.78 | 243.65 | +3.11 |
| Prev. Close | Volume | Bid | Ask | Time |
| 243.65 | 4089866 | 2026-04-02 16:19:11 |
| 52wk High | 570.18 | 52wk High Date | 2018-09-14 |
| 52wk Low | 388.97 | 52wk Low Date | 2017-12-01 |