Index Trend Analysis Report
Prepared for you on Monday, April 6, 2026.
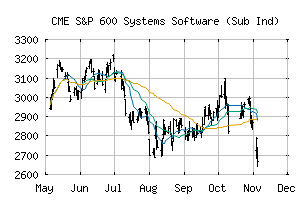
S&P 600 Systems Software (Sub Ind) (CME:SP600-45103020)
Bull Market Weakness (+75) - SP600-45103020 is showing signs of short-term weakness, but still remains in the confines of a long-term uptrend. Keep an eye on SP600-45103020 as it may be in the beginning stages of a reversal.
Is it time to buy, sell, or avoid SP600-45103020?
MarketClub looks at technical strength and momentum to determine if the timing is right for SP600-45103020.
Learn more about the Trade Triangles and how we make technical analysis as easy as buy and sell.
|
|||||||||||||||
|
|||||||||||||||
MarketClub’s Trade Triangles for SP600-45103020
![]() The long-term trend has been UP since Dec 9th, 2025 at 3097.43
The long-term trend has been UP since Dec 9th, 2025 at 3097.43
![]() The intermediate-term trend has been DOWN since Mar 27th, 2026 at 3111.11
The intermediate-term trend has been DOWN since Mar 27th, 2026 at 3111.11
![]() The short-term trend has been UP since Apr 1st, 2026 at 3167.31
The short-term trend has been UP since Apr 1st, 2026 at 3167.31
Smart Scan Analysis for SP600-45103020
Based on our trend formula, SP600-45103020 is rated as a +75 on a scale from -100 (Strong Downtrend) to +100 (Strong Uptrend).
| Open | High | Low | Price | Change |
|---|---|---|---|---|
| 3176.52 | 3268.31 | 3176.52 | 3268.24 | +82.74 |
| Prev. Close | Volume | Bid | Ask | Time |
| 3185.50 | 5994701 | 2026-04-06 16:19:41 |
| 52wk High | 2843.02 | 52wk High Date | 2018-06-14 |
| 52wk Low | 2043.48 | 52wk Low Date | 2018-11-20 |