Index Trend Analysis Report
Prepared for you on Tuesday, March 3, 2026.
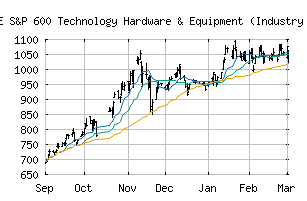
S&P 600 Technology Hardware & Equipment (Industry Group) (CME:SP600-4520)
Bull Market Weakness (+75) - SP600-4520 is showing signs of short-term weakness, but still remains in the confines of a long-term uptrend. Keep an eye on SP600-4520 as it may be in the beginning stages of a reversal.
Is it time to buy, sell, or avoid SP600-4520?
MarketClub looks at technical strength and momentum to determine if the timing is right for SP600-4520.
Learn more about the Trade Triangles and how we make technical analysis as easy as buy and sell.
|
|||||||||||||||
|
|||||||||||||||
MarketClub’s Trade Triangles for SP600-4520
![]() The long-term trend has been UP since Jun 4th, 2025 at 627.24
The long-term trend has been UP since Jun 4th, 2025 at 627.24
![]() The intermediate-term trend has been UP since Jan 6th, 2026 at 979.11
The intermediate-term trend has been UP since Jan 6th, 2026 at 979.11
![]() The short-term trend has been DOWN since Feb 27th, 2026 at 1050.60
The short-term trend has been DOWN since Feb 27th, 2026 at 1050.60
Smart Scan Analysis for SP600-4520
Based on our trend formula, SP600-4520 is rated as a +75 on a scale from -100 (Strong Downtrend) to +100 (Strong Uptrend).
| Open | High | Low | Price | Change |
|---|---|---|---|---|
| 1041.39 | 1063.77 | 1021.73 | 1051.57 | -24.62 |
| Prev. Close | Volume | Bid | Ask | Time |
| 1076.19 | 30903246 | 2026-03-03 16:19:56 |
| 52wk High | 430.17 | 52wk High Date | 2018-08-27 |
| 52wk Low | 340.77 | 52wk Low Date | 2018-10-29 |