Index Trend Analysis Report
Prepared for you on Tuesday, March 24, 2026.
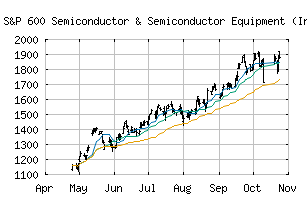
S&P 600 Semiconductor & Semiconductor Equipment (Industry) (CME:SP600-453010)
Crossroads (+60) - SP600-453010 is struggling to move into a solid trend. Beware of choppy markets and consider a sidelines position until a stronger trend is identified.
Is it time to buy, sell, or avoid SP600-453010?
MarketClub looks at technical strength and momentum to determine if the timing is right for SP600-453010.
Learn more about the Trade Triangles and how we make technical analysis as easy as buy and sell.
|
|||||||||||||||
|
|||||||||||||||
MarketClub’s Trade Triangles for SP600-453010
![]() The long-term trend has been UP since Jun 9th, 2025 at 1412.31
The long-term trend has been UP since Jun 9th, 2025 at 1412.31
![]() The intermediate-term trend has been DOWN since Mar 3rd, 2026 at 2231.42
The intermediate-term trend has been DOWN since Mar 3rd, 2026 at 2231.42
![]() The short-term trend has been DOWN since Mar 19th, 2026 at 2138.63
The short-term trend has been DOWN since Mar 19th, 2026 at 2138.63
Smart Scan Analysis for SP600-453010
Based on our trend formula, SP600-453010 is rated as a +60 on a scale from -100 (Strong Downtrend) to +100 (Strong Uptrend).
| Open | High | Low | Price | Change |
|---|---|---|---|---|
| 2140.45 | 2228.68 | 2139.50 | 2226.88 | +64.19 |
| Prev. Close | Volume | Bid | Ask | Time |
| 2162.69 | 5074547 | 2026-03-24 10:52:56 |
| 52wk High | 822.76 | 52wk High Date | 2018-06-06 |
| 52wk Low | 590.08 | 52wk Low Date | 2018-10-26 |