Index Trend Analysis Report
Prepared for you on Sunday, November 17, 2024.
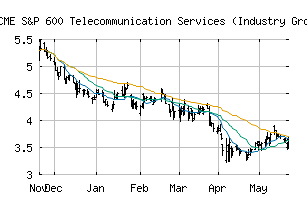
S&P 600 Telecommunication Services (Industry Group) (CME:SP600-5010)
Countertrend Up (+85) - SP600-5010 is showing short-term weakness. However, look for the longer-term bullish trend to resume. As always, continue to monitor the trend score and utilize a stop order.
Is it time to buy, sell, or avoid SP600-5010?
MarketClub looks at technical strength and momentum to determine if the timing is right for SP600-5010.
Learn more about the Trade Triangles and how we make technical analysis as easy as buy and sell.
|
|||||||||||||||
|
|||||||||||||||
MarketClub’s Trade Triangles for SP600-5010
![]() The long-term trend has been UP since Jul 15th, 2024 at 2.59
The long-term trend has been UP since Jul 15th, 2024 at 2.59
![]() The intermediate-term trend has been UP since Oct 18th, 2024 at 4.79
The intermediate-term trend has been UP since Oct 18th, 2024 at 4.79
![]() The short-term trend has been DOWN since Nov 12th, 2024 at 5.58
The short-term trend has been DOWN since Nov 12th, 2024 at 5.58
Smart Scan Analysis for SP600-5010
Based on our trend formula, SP600-5010 is rated as a +85 on a scale from -100 (Strong Downtrend) to +100 (Strong Uptrend).
| Open | High | Low | Price | Change |
|---|---|---|---|---|
| 5.43 | 5.46 | 5.31 | 5.40 | -0.01 |
| Prev. Close | Volume | Bid | Ask | Time |
| 5.40 | 15634296 | 2024-11-15 16:19:11 |
| 52wk High | 3.62 | 52wk High Date | 2018-10-01 |
| 52wk Low | 2.61 | 52wk Low Date | 2018-04-02 |