Index Trend Analysis Report
Prepared for you on Wednesday, February 5, 2025.
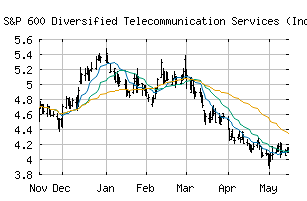
S&P 600 Diversified Telecommunication Services (Industry) (CME:SP600-501010)
Countertrend Down (-85) - SP600-501010 is showing short-term strength. However, look for the longer-term bearish trend to resume. As always, continue to monitor the trend score and set stops.
Is it time to buy, sell, or avoid SP600-501010?
MarketClub looks at technical strength and momentum to determine if the timing is right for SP600-501010.
Learn more about the Trade Triangles and how we make technical analysis as easy as buy and sell.
|
|||||||||||||||
|
|||||||||||||||
MarketClub’s Trade Triangles for SP600-501010
![]() The long-term trend has been DOWN since Jan 10th, 2025 at 7.70
The long-term trend has been DOWN since Jan 10th, 2025 at 7.70
![]() The intermediate-term trend has been DOWN since Jan 27th, 2025 at 7.51
The intermediate-term trend has been DOWN since Jan 27th, 2025 at 7.51
![]() The short-term trend has been UP since Feb 5th, 2025 at 7.61
The short-term trend has been UP since Feb 5th, 2025 at 7.61
Smart Scan Analysis for SP600-501010
Based on our trend formula, SP600-501010 is rated as a -85 on a scale from -100 (Strong Downtrend) to +100 (Strong Uptrend).
| Open | High | Low | Price | Change |
|---|---|---|---|---|
| 7.96 | 7.98 | 7.33 | 7.49 | -0.06 |
| Prev. Close | Volume | Bid | Ask | Time |
| 7.55 | 19079623 | 2025-02-05 12:38:41 |
| 52wk High | 6.2 | 52wk High Date | 2018-10-01 |
| 52wk Low | 4.42 | 52wk Low Date | 2018-04-02 |