Index Trend Analysis Report
Prepared for you on Tuesday, April 7, 2026.
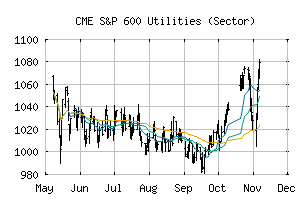
S&P 600 Utilities (Sector) (CME:SP600-55)
Strong Uptrend (+100) - SP600-55 is in a strong uptrend that is likely to continue. With short-term, intermediate, and long-term bullish momentum, SP600-55 continues to climb. Traders should protect gains and look for a change in score to suggest a slow down in momentum.
Is it time to buy, sell, or avoid SP600-55?
MarketClub looks at technical strength and momentum to determine if the timing is right for SP600-55.
Learn more about the Trade Triangles and how we make technical analysis as easy as buy and sell.
|
|||||||||||||||
|
|||||||||||||||
MarketClub’s Trade Triangles for SP600-55
![]() The long-term trend has been UP since Oct 10th, 2025 at 1042.64
The long-term trend has been UP since Oct 10th, 2025 at 1042.64
![]() The intermediate-term trend has been UP since Apr 1st, 2026 at 1134.36
The intermediate-term trend has been UP since Apr 1st, 2026 at 1134.36
![]() The short-term trend has been UP since Mar 24th, 2026 at 1114.83
The short-term trend has been UP since Mar 24th, 2026 at 1114.83
Smart Scan Analysis for SP600-55
Based on our trend formula, SP600-55 is rated as a +100 on a scale from -100 (Strong Downtrend) to +100 (Strong Uptrend).
| Open | High | Low | Price | Change |
|---|---|---|---|---|
| 1143.55 | 1154.93 | 1143.55 | 1152.00 | +5.27 |
| Prev. Close | Volume | Bid | Ask | Time |
| 1146.73 | 6056734 | 2026-04-07 16:19:29 |
| 52wk High | 1030.46 | 52wk High Date | 2018-11-20 |
| 52wk Low | 842.87 | 52wk Low Date | 2018-02-06 |