Index Trend Analysis Report
Prepared for you on Saturday, October 26, 2024.
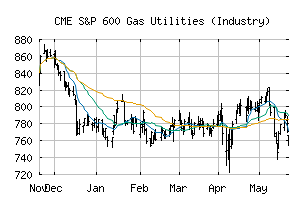
S&P 600 Gas Utilities (Industry) (CME:SP600-551020)
Sidelines Mode (-50) - SP600-551020 is failing to move into a strong trend and is encountering choppy trading conditions. Be cautious and consider taking a sidelines position until SP600-551020 can gain momentum.
Is it time to buy, sell, or avoid SP600-551020?
MarketClub looks at technical strength and momentum to determine if the timing is right for SP600-551020.
Learn more about the Trade Triangles and how we make technical analysis as easy as buy and sell.
|
|||||||||||||||
|
|||||||||||||||
MarketClub’s Trade Triangles for SP600-551020
![]() The long-term trend has been UP since May 1st, 2024 at 673.25
The long-term trend has been UP since May 1st, 2024 at 673.25
![]() The intermediate-term trend has been DOWN since Oct 7th, 2024 at 725.07
The intermediate-term trend has been DOWN since Oct 7th, 2024 at 725.07
![]() The short-term trend has been DOWN since Oct 21st, 2024 at 736.66
The short-term trend has been DOWN since Oct 21st, 2024 at 736.66
Smart Scan Analysis for SP600-551020
Based on our trend formula, SP600-551020 is rated as a -50 on a scale from -100 (Strong Downtrend) to +100 (Strong Uptrend).
| Open | High | Low | Price | Change |
|---|---|---|---|---|
| 737.40 | 738.71 | 731.31 | 731.84 | -0.76 |
| Prev. Close | Volume | Bid | Ask | Time |
| 731.84 | 298826 | 2024-10-25 16:19:56 |
| 52wk High | 881.76 | 52wk High Date | 2017-12-04 |
| 52wk Low | 660.6 | 52wk Low Date | 2018-02-06 |