Index Trend Analysis Report
Prepared for you on Wednesday, July 30, 2025.
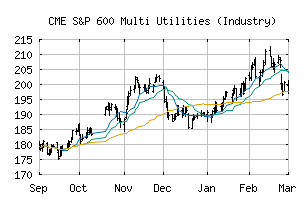
S&P 600 Multi Utilities (Industry) (CME:SP600-551030)
Countertrend Down (-85) - SP600-551030 is showing short-term strength. However, look for the longer-term bearish trend to resume. As always, continue to monitor the trend score and set stops.
Is it time to buy, sell, or avoid SP600-551030?
MarketClub looks at technical strength and momentum to determine if the timing is right for SP600-551030.
Learn more about the Trade Triangles and how we make technical analysis as easy as buy and sell.
|
|||||||||||||||
|
|||||||||||||||
MarketClub’s Trade Triangles for SP600-551030
![]() The long-term trend has been DOWN since Jun 16th, 2025 at 186.95
The long-term trend has been DOWN since Jun 16th, 2025 at 186.95
![]() The intermediate-term trend has been DOWN since Jul 16th, 2025 at 186.94
The intermediate-term trend has been DOWN since Jul 16th, 2025 at 186.94
![]() The short-term trend has been UP since Jul 30th, 2025 at 187.01
The short-term trend has been UP since Jul 30th, 2025 at 187.01
Smart Scan Analysis for SP600-551030
Based on our trend formula, SP600-551030 is rated as a -85 on a scale from -100 (Strong Downtrend) to +100 (Strong Uptrend).
| Open | High | Low | Price | Change |
|---|---|---|---|---|
| 186.56 | 188.18 | 186.05 | 187.19 | +1.50 |
| Prev. Close | Volume | Bid | Ask | Time |
| 185.69 | 864394 | 2025-07-30 16:20:11 |
| 52wk High | 259.37 | 52wk High Date | 2018-07-02 |
| 52wk Low | 233.39 | 52wk Low Date | 2018-03-07 |