Index Trend Analysis Report
Prepared for you on Monday, March 30, 2026.
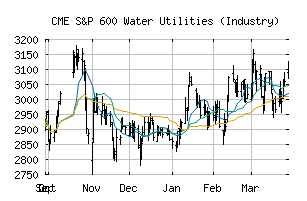
S&P 600 Water Utilities (Industry) (CME:SP600-551040)
Strong Uptrend (+100) - SP600-551040 is in a strong uptrend that is likely to continue. With short-term, intermediate, and long-term bullish momentum, SP600-551040 continues to climb. Traders should protect gains and look for a change in score to suggest a slow down in momentum.
Is it time to buy, sell, or avoid SP600-551040?
MarketClub looks at technical strength and momentum to determine if the timing is right for SP600-551040.
Learn more about the Trade Triangles and how we make technical analysis as easy as buy and sell.
|
|||||||||||||||
|
|||||||||||||||
MarketClub’s Trade Triangles for SP600-551040
![]() The long-term trend has been UP since Feb 17th, 2026 at 3091.01
The long-term trend has been UP since Feb 17th, 2026 at 3091.01
![]() The intermediate-term trend has been UP since Mar 30th, 2026 at 3113.68
The intermediate-term trend has been UP since Mar 30th, 2026 at 3113.68
![]() The short-term trend has been UP since Mar 26th, 2026 at 3059.05
The short-term trend has been UP since Mar 26th, 2026 at 3059.05
Smart Scan Analysis for SP600-551040
Based on our trend formula, SP600-551040 is rated as a +100 on a scale from -100 (Strong Downtrend) to +100 (Strong Uptrend).
| Open | High | Low | Price | Change |
|---|---|---|---|---|
| 3089.19 | 3128.27 | 3069.00 | 3122.90 | +63.02 |
| Prev. Close | Volume | Bid | Ask | Time |
| 3059.88 | 1335687 | 2026-03-30 16:07:26 |
| 52wk High | 3153.11 | 52wk High Date | 2018-11-28 |
| 52wk Low | 2348.02 | 52wk Low Date | 2018-03-06 |