Index Trend Analysis Report
Prepared for you on Sunday, May 11, 2025.
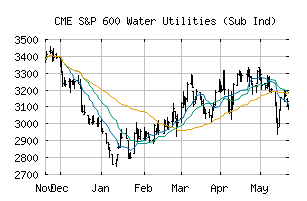
S&P 600 Water Utilities (Sub Ind) (CME:SP600-55104010)
Weak Uptrend (+65) - SP600-55104010 is showing signs of weakening momentum to the upside. Monitor SP600-55104010 as it may be in the beginning stages of a reversal.
Is it time to buy, sell, or avoid SP600-55104010?
MarketClub looks at technical strength and momentum to determine if the timing is right for SP600-55104010.
Learn more about the Trade Triangles and how we make technical analysis as easy as buy and sell.
|
|||||||||||||||
|
|||||||||||||||
MarketClub’s Trade Triangles for SP600-55104010
![]() The long-term trend has been UP since Apr 3rd, 2025 at 3294.19
The long-term trend has been UP since Apr 3rd, 2025 at 3294.19
![]() The intermediate-term trend has been UP since Apr 3rd, 2025 at 3294.19
The intermediate-term trend has been UP since Apr 3rd, 2025 at 3294.19
![]() The short-term trend has been DOWN since May 2nd, 2025 at 3237.56
The short-term trend has been DOWN since May 2nd, 2025 at 3237.56
Smart Scan Analysis for SP600-55104010
Based on our trend formula, SP600-55104010 is rated as a +65 on a scale from -100 (Strong Downtrend) to +100 (Strong Uptrend).
| Open | High | Low | Price | Change |
|---|---|---|---|---|
| 3193.09 | 3211.29 | 3184.36 | 3203.45 | -1.61 |
| Prev. Close | Volume | Bid | Ask | Time |
| 3203.45 | 598225 | 2025-05-09 16:19:56 |
| 52wk High | 3153.11 | 52wk High Date | 2018-11-28 |
| 52wk Low | 2348.02 | 52wk Low Date | 2018-03-06 |