Index Trend Analysis Report
Prepared for you on Monday, March 30, 2026.
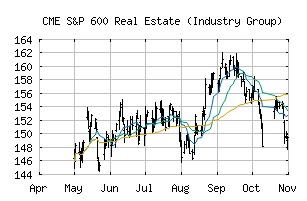
S&P 600 Real Estate (Industry Group) (CME:SP600-6010)
Strong Downtrend (-100) - SP600-6010 is in a strong downtrend that is likely to continue. With short-term, intermediate, and long-term bearish momentum, SP600-6010 continues to fall. Traders should use caution and set stops.
Is it time to buy, sell, or avoid SP600-6010?
MarketClub looks at technical strength and momentum to determine if the timing is right for SP600-6010.
Learn more about the Trade Triangles and how we make technical analysis as easy as buy and sell.
|
|||||||||||||||
|
|||||||||||||||
MarketClub’s Trade Triangles for SP600-6010
![]() The long-term trend has been DOWN since Mar 27th, 2026 at 151.87
The long-term trend has been DOWN since Mar 27th, 2026 at 151.87
![]() The intermediate-term trend has been DOWN since Mar 9th, 2026 at 160.46
The intermediate-term trend has been DOWN since Mar 9th, 2026 at 160.46
![]() The short-term trend has been DOWN since Mar 3rd, 2026 at 163.26
The short-term trend has been DOWN since Mar 3rd, 2026 at 163.26
Smart Scan Analysis for SP600-6010
Based on our trend formula, SP600-6010 is rated as a -100 on a scale from -100 (Strong Downtrend) to +100 (Strong Uptrend).
| Open | High | Low | Price | Change |
|---|---|---|---|---|
| 152.56 | 153.98 | 151.78 | 152.51 | +1.22 |
| Prev. Close | Volume | Bid | Ask | Time |
| 151.29 | 17210887 | 2026-03-30 14:15:24 |
| 52wk High | 225.6 | 52wk High Date | 2017-12-06 |
| 52wk Low | 172.73 | 52wk Low Date | 2018-02-12 |