Index Trend Analysis Report
Prepared for you on Saturday, March 7, 2026.
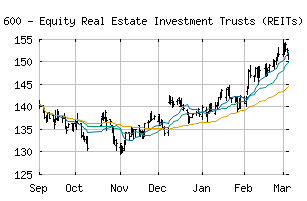
S&P 600 - Equity Real Estate Investment Trusts (REITs) (Industry) (CME:SP600-601010)
Countertrend Up (+85) - SP600-601010 is showing short-term weakness. However, look for the longer-term bullish trend to resume. As always, continue to monitor the trend score and utilize a stop order.
Is it time to buy, sell, or avoid SP600-601010?
MarketClub looks at technical strength and momentum to determine if the timing is right for SP600-601010.
Learn more about the Trade Triangles and how we make technical analysis as easy as buy and sell.
|
|||||||||||||||
|
|||||||||||||||
MarketClub’s Trade Triangles for SP600-601010
![]() The long-term trend has been UP since Dec 9th, 2025 at 141.34
The long-term trend has been UP since Dec 9th, 2025 at 141.34
![]() The intermediate-term trend has been UP since Nov 24th, 2025 at 136.39
The intermediate-term trend has been UP since Nov 24th, 2025 at 136.39
![]() The short-term trend has been DOWN since Mar 6th, 2026 at 151.64
The short-term trend has been DOWN since Mar 6th, 2026 at 151.64
Smart Scan Analysis for SP600-601010
Based on our trend formula, SP600-601010 is rated as a +85 on a scale from -100 (Strong Downtrend) to +100 (Strong Uptrend).
| Open | High | Low | Price | Change |
|---|---|---|---|---|
| 151.53 | 152.09 | 150.47 | 152.03 | -0.44 |
| Prev. Close | Volume | Bid | Ask | Time |
| 152.03 | 5742774 | 2026-03-06 16:20:09 |
| 52wk High | 226.36 | 52wk High Date | 2017-12-06 |
| 52wk Low | 170.06 | 52wk Low Date | 2018-03-23 |