Index Trend Analysis Report
Prepared for you on Sunday, March 22, 2026.
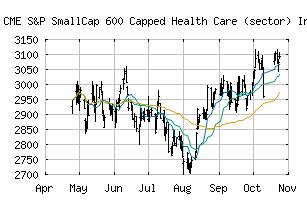
S&P SmallCap 600 Capped Health Care (sector) Index (CME:SP600C-35)
Strong Downtrend (-100) - SP600C-35 is in a strong downtrend that is likely to continue. With short-term, intermediate, and long-term bearish momentum, SP600C-35 continues to fall. Traders should use caution and set stops.
Is it time to buy, sell, or avoid SP600C-35?
MarketClub looks at technical strength and momentum to determine if the timing is right for SP600C-35.
Learn more about the Trade Triangles and how we make technical analysis as easy as buy and sell.
|
|||||||||||||||
|
|||||||||||||||
MarketClub’s Trade Triangles for SP600C-35
![]() The long-term trend has been DOWN since Mar 6th, 2026 at 3021.61
The long-term trend has been DOWN since Mar 6th, 2026 at 3021.61
![]() The intermediate-term trend has been DOWN since Feb 3rd, 2026 at 3167.00
The intermediate-term trend has been DOWN since Feb 3rd, 2026 at 3167.00
![]() The short-term trend has been DOWN since Mar 19th, 2026 at 2900.62
The short-term trend has been DOWN since Mar 19th, 2026 at 2900.62
Smart Scan Analysis for SP600C-35
Based on our trend formula, SP600C-35 is rated as a -100 on a scale from -100 (Strong Downtrend) to +100 (Strong Uptrend).
| Open | High | Low | Price | Change |
|---|---|---|---|---|
| 2930.73 | 2933.77 | 2851.53 | 2862.80 | -56.10 |
| Prev. Close | Volume | Bid | Ask | Time |
| 2862.80 | 0 | 2026-03-20 16:20:03 |
| 52wk High | 3476.1 | 52wk High Date | 2018-08-31 |
| 52wk Low | 2260.79 | 52wk Low Date | 2017-12-06 |