Index Trend Analysis Report
Prepared for you on Friday, March 13, 2026.
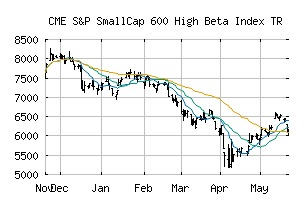
S&P SmallCap 600 High Beta Index TR (CME:SP6HBIT)
Weak Downtrend (-65) - SP6HBIT is showing signs of a strengthening downtrend. Monitor SP6HBIT as it may be building momentum to the downside.
Is it time to buy, sell, or avoid SP6HBIT?
MarketClub looks at technical strength and momentum to determine if the timing is right for SP6HBIT.
Learn more about the Trade Triangles and how we make technical analysis as easy as buy and sell.
|
|||||||||||||||
|
|||||||||||||||
MarketClub’s Trade Triangles for SP6HBIT
![]() The long-term trend has been UP since Jul 1st, 2025 at 6718.46
The long-term trend has been UP since Jul 1st, 2025 at 6718.46
![]() The intermediate-term trend has been DOWN since Mar 3rd, 2026 at 9195.54
The intermediate-term trend has been DOWN since Mar 3rd, 2026 at 9195.54
![]() The short-term trend has been DOWN since Feb 27th, 2026 at 9326.00
The short-term trend has been DOWN since Feb 27th, 2026 at 9326.00
Smart Scan Analysis for SP6HBIT
Based on our trend formula, SP6HBIT is rated as a -70 on a scale from -100 (Strong Downtrend) to +100 (Strong Uptrend).
| Open | High | Low | Price | Change |
|---|---|---|---|---|
| 8872.35 | 8872.35 | 8699.39 | 8705.88 | -252.82 |
| Prev. Close | Volume | Bid | Ask | Time |
| 8705.88 | 0 | 2026-03-12 16:19:58 |