Index Trend Analysis Report
Prepared for you on Saturday, April 4, 2026.
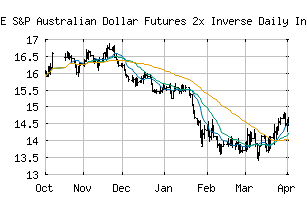
S&P Australian Dollar Futures 2x Inverse Daily Index ER (CME:SPADFP2I)
Sidelines Mode (+55) - SPADFP2I is moving in a sideways pattern and is unable to gain momentum in either direction. Beware of choppy movement and consider a sidelines position until a stronger trend is identified.
Is it time to buy, sell, or avoid SPADFP2I?
MarketClub looks at technical strength and momentum to determine if the timing is right for SPADFP2I.
Learn more about the Trade Triangles and how we make technical analysis as easy as buy and sell.
|
|||||||||||||||
|
|||||||||||||||
MarketClub’s Trade Triangles for SPADFP2I
![]() The long-term trend has been DOWN since Apr 15th, 2025 at 17.286
The long-term trend has been DOWN since Apr 15th, 2025 at 17.286
![]() The intermediate-term trend has been UP since Mar 23rd, 2026 at 14.376
The intermediate-term trend has been UP since Mar 23rd, 2026 at 14.376
![]() The short-term trend has been DOWN since Mar 31st, 2026 at 14.490
The short-term trend has been DOWN since Mar 31st, 2026 at 14.490
Smart Scan Analysis for SPADFP2I
Based on our trend formula, SPADFP2I is rated as a +55 on a scale from -100 (Strong Downtrend) to +100 (Strong Uptrend).
| Open | High | Low | Price | Change |
|---|---|---|---|---|
| 14.611 | 14.703 | 14.460 | 14.511 | -0.077 |
| Prev. Close | Volume | Bid | Ask | Time |
| 14.511 | 0 | 2026-04-02 16:26:29 |