Index Trend Analysis Report
Prepared for you on Tuesday, May 13, 2025.
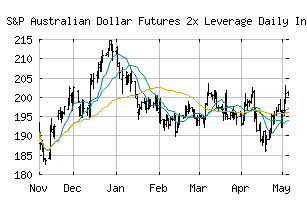
S&P Australian Dollar Futures 2x Leverage Daily Index TR (CME:SPADFT2L)
Countertrend Up (+85) - SPADFT2L is showing short-term weakness. However, look for the longer-term bullish trend to resume. As always, continue to monitor the trend score and utilize a stop order.
Is it time to buy, sell, or avoid SPADFT2L?
MarketClub looks at technical strength and momentum to determine if the timing is right for SPADFT2L.
Learn more about the Trade Triangles and how we make technical analysis as easy as buy and sell.
|
|||||||||||||||
|
|||||||||||||||
MarketClub’s Trade Triangles for SPADFT2L
![]() The long-term trend has been UP since Apr 21st, 2025 at 193.07
The long-term trend has been UP since Apr 21st, 2025 at 193.07
![]() The intermediate-term trend has been UP since Apr 20th, 2025 at 192.50
The intermediate-term trend has been UP since Apr 20th, 2025 at 192.50
![]() The short-term trend has been UP since May 12th, 2025 at 196.65
The short-term trend has been UP since May 12th, 2025 at 196.65
Smart Scan Analysis for SPADFT2L
Based on our trend formula, SPADFT2L is rated as a +80 on a scale from -100 (Strong Downtrend) to +100 (Strong Uptrend).
| Open | High | Low | Price | Change |
|---|---|---|---|---|
| 193.10 | 194.00 | 193.07 | 193.88 | +1.29 |
| Prev. Close | Volume | Bid | Ask | Time |
| 192.59 | 0 | 2025-05-13 00:46:25 |