Index Trend Analysis Report
Prepared for you on Monday, June 30, 2025.
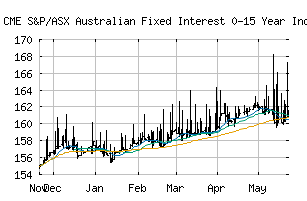
S&P/ASX Australian Fixed Interest 0-15 Year Index (CME:SPBA15T)
Countertrend Up (+85) - SPBA15T is showing short-term weakness. However, look for the longer-term bullish trend to resume. As always, continue to monitor the trend score and utilize a stop order.
Is it time to buy, sell, or avoid SPBA15T?
MarketClub looks at technical strength and momentum to determine if the timing is right for SPBA15T.
Learn more about the Trade Triangles and how we make technical analysis as easy as buy and sell.
|
|||||||||||||||
|
|||||||||||||||
MarketClub’s Trade Triangles for SPBA15T
![]() The long-term trend has been UP since Dec 3rd, 2024 at 158.82
The long-term trend has been UP since Dec 3rd, 2024 at 158.82
![]() The intermediate-term trend has been UP since May 29th, 2025 at 168.21
The intermediate-term trend has been UP since May 29th, 2025 at 168.21
![]() The short-term trend has been DOWN since Jun 30th, 2025 at 163.56
The short-term trend has been DOWN since Jun 30th, 2025 at 163.56
Smart Scan Analysis for SPBA15T
Based on our trend formula, SPBA15T is rated as a +85 on a scale from -100 (Strong Downtrend) to +100 (Strong Uptrend).
| Open | High | Low | Price | Change |
|---|---|---|---|---|
| 163.56 | 174.08 | 163.52 | 163.95 | +0.39 |
| Prev. Close | Volume | Bid | Ask | Time |
| 163.56 | 0 | 2025-06-30 23:43:20 |