Index Trend Analysis Report
Prepared for you on Thursday, December 26, 2024.
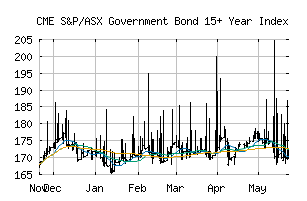
S&P/ASX Government Bond 15+ Year Index (CME:SPBAG16T)
Bear Market Rally (-75) - SPBAG16T is showing some rallying power, but still remains in the confines of a long-term downtrend. Keep an eye on SPBAG16T as it may be in the beginning of a reversal.
Is it time to buy, sell, or avoid SPBAG16T?
MarketClub looks at technical strength and momentum to determine if the timing is right for SPBAG16T.
Learn more about the Trade Triangles and how we make technical analysis as easy as buy and sell.
|
|||||||||||||||
|
|||||||||||||||
MarketClub’s Trade Triangles for SPBAG16T
![]() The long-term trend has been DOWN since Oct 31st, 2024 at 166.89
The long-term trend has been DOWN since Oct 31st, 2024 at 166.89
![]() The intermediate-term trend has been DOWN since Dec 19th, 2024 at 168.93
The intermediate-term trend has been DOWN since Dec 19th, 2024 at 168.93
![]() The short-term trend has been UP since Dec 23rd, 2024 at 173.83
The short-term trend has been UP since Dec 23rd, 2024 at 173.83
Smart Scan Analysis for SPBAG16T
Based on our trend formula, SPBAG16T is rated as a -75 on a scale from -100 (Strong Downtrend) to +100 (Strong Uptrend).
| Open | High | Low | Price | Change |
|---|---|---|---|---|
| 170.34 | 170.34 | 170.34 | 170.34 | 0.00 |
| Prev. Close | Volume | Bid | Ask | Time |
| 170.70 | 0 | 2024-12-24 01:00:00 |