Index Trend Analysis Report
Prepared for you on Thursday, December 26, 2024.
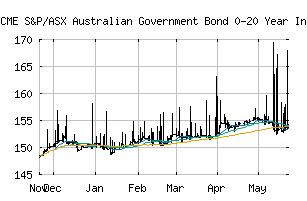
S&P/ASX Australian Government Bond 0-20 Year Index (CME:SPBAS20T)
Weak Uptrend (+65) - SPBAS20T is showing signs of weakening momentum to the upside. Monitor SPBAS20T as it may be in the beginning stages of a reversal.
Is it time to buy, sell, or avoid SPBAS20T?
MarketClub looks at technical strength and momentum to determine if the timing is right for SPBAS20T.
Learn more about the Trade Triangles and how we make technical analysis as easy as buy and sell.
|
|||||||||||||||
|
|||||||||||||||
MarketClub’s Trade Triangles for SPBAS20T
![]() The long-term trend has been UP since Dec 4th, 2024 at 154.44
The long-term trend has been UP since Dec 4th, 2024 at 154.44
![]() The intermediate-term trend has been UP since Nov 18th, 2024 at 149.54
The intermediate-term trend has been UP since Nov 18th, 2024 at 149.54
![]() The short-term trend has been DOWN since Dec 18th, 2024 at 150.51
The short-term trend has been DOWN since Dec 18th, 2024 at 150.51
Smart Scan Analysis for SPBAS20T
Based on our trend formula, SPBAS20T is rated as a +65 on a scale from -100 (Strong Downtrend) to +100 (Strong Uptrend).
| Open | High | Low | Price | Change |
|---|---|---|---|---|
| 150.02 | 150.02 | 150.02 | 150.02 | 0.00 |
| Prev. Close | Volume | Bid | Ask | Time |
| 150.06 | 0 | 2024-12-24 01:00:00 |