Index Trend Analysis Report
Prepared for you on Tuesday, May 13, 2025.
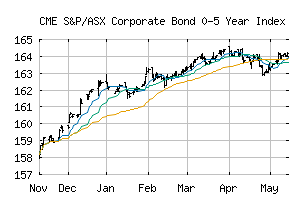
S&P/ASX Corporate Bond 0-5 Year Index (CME:SPBDC05T)
Weak Uptrend (+65) - SPBDC05T is showing signs of weakening momentum to the upside. Monitor SPBDC05T as it may be in the beginning stages of a reversal.
Is it time to buy, sell, or avoid SPBDC05T?
MarketClub looks at technical strength and momentum to determine if the timing is right for SPBDC05T.
Learn more about the Trade Triangles and how we make technical analysis as easy as buy and sell.
|
|||||||||||||||
|
|||||||||||||||
MarketClub’s Trade Triangles for SPBDC05T
![]() The long-term trend has been UP since Aug 23rd, 2023 at 158.28
The long-term trend has been UP since Aug 23rd, 2023 at 158.28
![]() The intermediate-term trend has been UP since Nov 10th, 2024 at 169.20
The intermediate-term trend has been UP since Nov 10th, 2024 at 169.20
![]() The short-term trend has been DOWN since May 12th, 2025 at 175.03
The short-term trend has been DOWN since May 12th, 2025 at 175.03
Smart Scan Analysis for SPBDC05T
Based on our trend formula, SPBDC05T is rated as a +65 on a scale from -100 (Strong Downtrend) to +100 (Strong Uptrend).
| Open | High | Low | Price | Change |
|---|---|---|---|---|
| 174.81 | 174.89 | 174.70 | 174.89 | +0.10 |
| Prev. Close | Volume | Bid | Ask | Time |
| 174.79 | 0 | 2025-05-13 03:52:32 |