Index Trend Analysis Report
Prepared for you on Sunday, December 14, 2025.
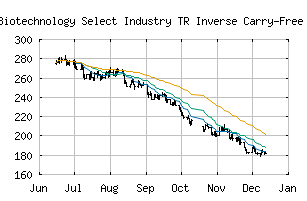
S&P Biotechnology Select Industry TR Inverse Carry-Free Daily Index (CME:SPBSICUT)
Countertrend Down (-85) - SPBSICUT is showing short-term strength. However, look for the longer-term bearish trend to resume. As always, continue to monitor the trend score and set stops.
Is it time to buy, sell, or avoid SPBSICUT?
MarketClub looks at technical strength and momentum to determine if the timing is right for SPBSICUT.
Learn more about the Trade Triangles and how we make technical analysis as easy as buy and sell.
|
|||||||||||||||
|
|||||||||||||||
MarketClub’s Trade Triangles for SPBSICUT
![]() The long-term trend has been DOWN since Jun 10th, 2025 at 268.11
The long-term trend has been DOWN since Jun 10th, 2025 at 268.11
![]() The intermediate-term trend has been DOWN since Apr 28th, 2025 at 286.74
The intermediate-term trend has been DOWN since Apr 28th, 2025 at 286.74
![]() The short-term trend has been UP since Dec 10th, 2025 at 185.09
The short-term trend has been UP since Dec 10th, 2025 at 185.09
Smart Scan Analysis for SPBSICUT
Based on our trend formula, SPBSICUT is rated as a -85 on a scale from -100 (Strong Downtrend) to +100 (Strong Uptrend).
| Open | High | Low | Price | Change |
|---|---|---|---|---|
| 182.21 | 183.79 | 181.35 | 182.05 | -0.16 |
| Prev. Close | Volume | Bid | Ask | Time |
| 182.05 | 0 | 2025-12-12 16:52:58 |