Index Trend Analysis Report
Prepared for you on Tuesday, March 17, 2026.
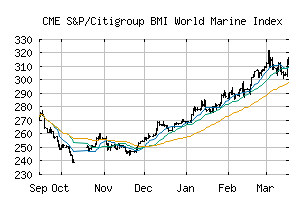
S&P/Citigroup BMI World Marine Index (CME:SPCBMIRWD20303010USD)
Strong Uptrend (+100) - SPCBMIRWD20303010USD is in a strong uptrend that is likely to continue. With short-term, intermediate, and long-term bullish momentum, SPCBMIRWD20303010USD continues to climb. Traders should protect gains and look for a change in score to suggest a slow down in momentum.
Is it time to buy, sell, or avoid SPCBMIRWD20303010USD?
MarketClub looks at technical strength and momentum to determine if the timing is right for SPCBMIRWD20303010USD.
Learn more about the Trade Triangles and how we make technical analysis as easy as buy and sell.
|
|||||||||||||||
|
|||||||||||||||
MarketClub’s Trade Triangles for SPCBMIRWD20303010USD
![]() The long-term trend has been UP since Jan 5th, 2026 at 270.50
The long-term trend has been UP since Jan 5th, 2026 at 270.50
![]() The intermediate-term trend has been UP since Nov 30th, 2025 at 254.67
The intermediate-term trend has been UP since Nov 30th, 2025 at 254.67
![]() The short-term trend has been UP since Mar 16th, 2026 at 309.50
The short-term trend has been UP since Mar 16th, 2026 at 309.50
Smart Scan Analysis for SPCBMIRWD20303010USD
Based on our trend formula, SPCBMIRWD20303010USD is rated as a +100 on a scale from -100 (Strong Downtrend) to +100 (Strong Uptrend).
| Open | High | Low | Price | Change |
|---|---|---|---|---|
| 313.59 | 315.87 | 311.46 | 315.87 | +0.40 |
| Prev. Close | Volume | Bid | Ask | Time |
| 315.47 | 0 | 2026-03-17 12:23:55 |