Index Trend Analysis Report
Prepared for you on Saturday, March 21, 2026.
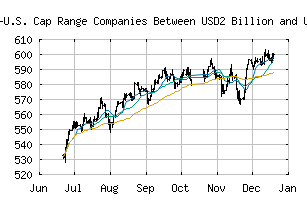
S&P Developed Ex-U.S. Cap Range Companies Between USD2 Billion and USD5 Billion (US Dollar) (CME:SPCRR2B5BRWUUSD)
Crossroads (-60) - SPCRR2B5BRWUUSD is struggling to move into a solid trend. Beware of choppy markets and consider a sidelines position until a stronger trend is identified.
Is it time to buy, sell, or avoid SPCRR2B5BRWUUSD?
MarketClub looks at technical strength and momentum to determine if the timing is right for SPCRR2B5BRWUUSD.
Learn more about the Trade Triangles and how we make technical analysis as easy as buy and sell.
|
|||||||||||||||
|
|||||||||||||||
MarketClub’s Trade Triangles for SPCRR2B5BRWUUSD
![]() The long-term trend has been UP since Apr 30th, 2025 at 495.13
The long-term trend has been UP since Apr 30th, 2025 at 495.13
![]() The intermediate-term trend has been DOWN since Mar 3rd, 2026 at 652.55
The intermediate-term trend has been DOWN since Mar 3rd, 2026 at 652.55
![]() The short-term trend has been DOWN since Mar 19th, 2026 at 622.58
The short-term trend has been DOWN since Mar 19th, 2026 at 622.58
Smart Scan Analysis for SPCRR2B5BRWUUSD
Based on our trend formula, SPCRR2B5BRWUUSD is rated as a -60 on a scale from -100 (Strong Downtrend) to +100 (Strong Uptrend).
| Open | High | Low | Price | Change |
|---|---|---|---|---|
| 621.99 | 624.04 | 613.66 | 614.88 | -7.27 |
| Prev. Close | Volume | Bid | Ask | Time |
| 614.96 | 0 | 2026-03-20 16:19:45 |
| 52wk High | 506.58 | 52wk High Date | 2018-01-25 |
| 52wk Low | 405.02 | 52wk Low Date | 2018-10-26 |