Index Trend Analysis Report
Prepared for you on Monday, March 16, 2026.
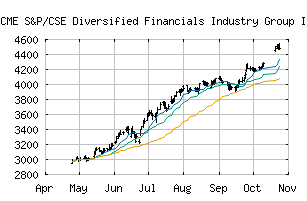
S&P/CSE Diversified Financials Industry Group Index (CME:SPCSEDFP)
Strong Downtrend (-100) - SPCSEDFP is in a strong downtrend that is likely to continue. With short-term, intermediate, and long-term bearish momentum, SPCSEDFP continues to fall. Traders should use caution and set stops.
Is it time to buy, sell, or avoid SPCSEDFP?
MarketClub looks at technical strength and momentum to determine if the timing is right for SPCSEDFP.
Learn more about the Trade Triangles and how we make technical analysis as easy as buy and sell.
|
|||||||||||||||
|
|||||||||||||||
MarketClub’s Trade Triangles for SPCSEDFP
![]() The long-term trend has been DOWN since Mar 3rd, 2026 at 3913.32
The long-term trend has been DOWN since Mar 3rd, 2026 at 3913.32
![]() The intermediate-term trend has been DOWN since Feb 12th, 2026 at 4167.18
The intermediate-term trend has been DOWN since Feb 12th, 2026 at 4167.18
![]() The short-term trend has been DOWN since Mar 3rd, 2026 at 4104.24
The short-term trend has been DOWN since Mar 3rd, 2026 at 4104.24
Smart Scan Analysis for SPCSEDFP
Based on our trend formula, SPCSEDFP is rated as a -100 on a scale from -100 (Strong Downtrend) to +100 (Strong Uptrend).
| Open | High | Low | Price | Change |
|---|---|---|---|---|
| 3702.58 | 3702.81 | 3571.27 | 3656.81 | -128.57 |
| Prev. Close | Volume | Bid | Ask | Time |
| 3785.38 | 0 | 2026-03-16 05:29:58 |