Index Trend Analysis Report
Prepared for you on Saturday, April 4, 2026.
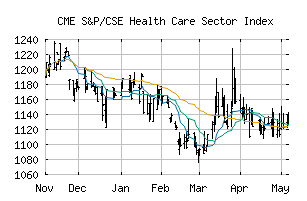
S&P/CSE Health Care Sector Index (CME:SPCSEHCP)
Weak Downtrend (-65) - SPCSEHCP is showing signs of a strengthening downtrend. Monitor SPCSEHCP as it may be building momentum to the downside.
Is it time to buy, sell, or avoid SPCSEHCP?
MarketClub looks at technical strength and momentum to determine if the timing is right for SPCSEHCP.
Learn more about the Trade Triangles and how we make technical analysis as easy as buy and sell.
|
|||||||||||||||
|
|||||||||||||||
MarketClub’s Trade Triangles for SPCSEHCP
![]() The long-term trend has been UP since May 29th, 2025 at 1155.43
The long-term trend has been UP since May 29th, 2025 at 1155.43
![]() The intermediate-term trend has been DOWN since Mar 3rd, 2026 at 1840.27
The intermediate-term trend has been DOWN since Mar 3rd, 2026 at 1840.27
![]() The short-term trend has been DOWN since Mar 30th, 2026 at 1636.37
The short-term trend has been DOWN since Mar 30th, 2026 at 1636.37
Smart Scan Analysis for SPCSEHCP
Based on our trend formula, SPCSEHCP is rated as a -70 on a scale from -100 (Strong Downtrend) to +100 (Strong Uptrend).
| Open | High | Low | Price | Change |
|---|---|---|---|---|
| 1619.28 | 1636.39 | 1610.56 | 1616.98 | -2.20 |
| Prev. Close | Volume | Bid | Ask | Time |
| 1616.98 | 0 | 2026-04-02 05:56:57 |