Index Trend Analysis Report
Prepared for you on Friday, March 20, 2026.
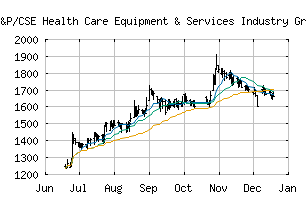
S&P/CSE Health Care Equipment & Services Industry Group Index (CME:SPCSEHSP)
Crossroads (-60) - SPCSEHSP is struggling to move into a solid trend. Beware of choppy markets and consider a sidelines position until a stronger trend is identified.
Is it time to buy, sell, or avoid SPCSEHSP?
MarketClub looks at technical strength and momentum to determine if the timing is right for SPCSEHSP.
Learn more about the Trade Triangles and how we make technical analysis as easy as buy and sell.
|
|||||||||||||||
|
|||||||||||||||
MarketClub’s Trade Triangles for SPCSEHSP
![]() The long-term trend has been UP since May 29th, 2025 at 1213.30
The long-term trend has been UP since May 29th, 2025 at 1213.30
![]() The intermediate-term trend has been DOWN since Mar 3rd, 2026 at 1932.45
The intermediate-term trend has been DOWN since Mar 3rd, 2026 at 1932.45
![]() The short-term trend has been DOWN since Mar 16th, 2026 at 1775.40
The short-term trend has been DOWN since Mar 16th, 2026 at 1775.40
Smart Scan Analysis for SPCSEHSP
Based on our trend formula, SPCSEHSP is rated as a -60 on a scale from -100 (Strong Downtrend) to +100 (Strong Uptrend).
| Open | High | Low | Price | Change |
|---|---|---|---|---|
| 1741.16 | 1741.16 | 1701.31 | 1720.92 | +16.42 |
| Prev. Close | Volume | Bid | Ask | Time |
| 1704.50 | 0 | 2026-03-20 01:55:03 |