Index Trend Analysis Report
Prepared for you on Wednesday, July 30, 2025.
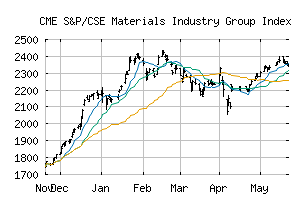
S&P/CSE Materials Industry Group Index (CME:SPCSEMIP)
Long-Term Uptrend (+90) - SPCSEMIP is in a strong uptrend that is likely to continue. While SPCSEMIP is showing intraday weakness, it remains in the confines of a bullish trend. Traders should use caution and utilize a stop order.
Is it time to buy, sell, or avoid SPCSEMIP?
MarketClub looks at technical strength and momentum to determine if the timing is right for SPCSEMIP.
Learn more about the Trade Triangles and how we make technical analysis as easy as buy and sell.
|
|||||||||||||||
|
|||||||||||||||
MarketClub’s Trade Triangles for SPCSEMIP
![]() The long-term trend has been UP since Jun 2nd, 2025 at 2402.03
The long-term trend has been UP since Jun 2nd, 2025 at 2402.03
![]() The intermediate-term trend has been UP since Jun 27th, 2025 at 2524.21
The intermediate-term trend has been UP since Jun 27th, 2025 at 2524.21
![]() The short-term trend has been UP since Jul 30th, 2025 at 2701.32
The short-term trend has been UP since Jul 30th, 2025 at 2701.32
Smart Scan Analysis for SPCSEMIP
Based on our trend formula, SPCSEMIP is rated as a +90 on a scale from -100 (Strong Downtrend) to +100 (Strong Uptrend).
| Open | High | Low | Price | Change |
|---|---|---|---|---|
| 2691.34 | 2717.82 | 2683.88 | 2705.48 | +26.37 |
| Prev. Close | Volume | Bid | Ask | Time |
| 2679.11 | 0 | 2025-07-30 05:27:23 |