Index Trend Analysis Report
Prepared for you on Thursday, April 25, 2024.
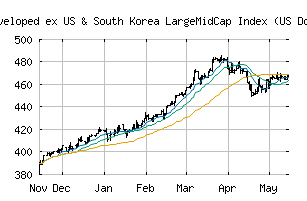
S&P Momentum Developed ex US & South Korea LargeMidCap Index (US Dollar) Net Total Return (CME:SPDUKMUN)
Sidelines Mode (-55) - SPDUKMUN is moving in a sideways pattern and is unable to gain momentum in either direction. Beware of choppy movement and consider a sidelines position until a stronger trend is identified.
Is it time to buy, sell, or avoid SPDUKMUN?
MarketClub looks at technical strength and momentum to determine if the timing is right for SPDUKMUN.
Learn more about the Trade Triangles and how we make technical analysis as easy as buy and sell.
|
|||||||||||||||
|
|||||||||||||||
MarketClub’s Trade Triangles for SPDUKMUN
![]() The long-term trend has been UP since Apr 12th, 2023 at 365.69
The long-term trend has been UP since Apr 12th, 2023 at 365.69
![]() The intermediate-term trend has been DOWN since Apr 14th, 2024 at 469.08
The intermediate-term trend has been DOWN since Apr 14th, 2024 at 469.08
![]() The short-term trend has been UP since Apr 23rd, 2024 at 457.24
The short-term trend has been UP since Apr 23rd, 2024 at 457.24
Smart Scan Analysis for SPDUKMUN
Based on our trend formula, SPDUKMUN is rated as a -55 on a scale from -100 (Strong Downtrend) to +100 (Strong Uptrend).
| Open | High | Low | Price | Change |
|---|---|---|---|---|
| 457.91 | 458.15 | 452.48 | 452.97 | -5.89 |
| Prev. Close | Volume | Bid | Ask | Time |
| 458.86 | 0 | 2024-04-25 10:06:36 |