Index Trend Analysis Report
Prepared for you on Friday, December 19, 2025.
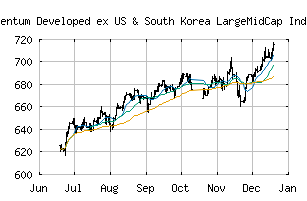
S&P Momentum Developed ex US & South Korea LargeMidCap Index (US Dollar) (CME:SPDUKMUP)
Long-Term Uptrend (+90) - SPDUKMUP is in a strong uptrend that is likely to continue. While SPDUKMUP is showing intraday weakness, it remains in the confines of a bullish trend. Traders should use caution and utilize a stop order.
Is it time to buy, sell, or avoid SPDUKMUP?
MarketClub looks at technical strength and momentum to determine if the timing is right for SPDUKMUP.
Learn more about the Trade Triangles and how we make technical analysis as easy as buy and sell.
|
|||||||||||||||
|
|||||||||||||||
MarketClub’s Trade Triangles for SPDUKMUP
![]() The long-term trend has been UP since Apr 23rd, 2025 at 577.30
The long-term trend has been UP since Apr 23rd, 2025 at 577.30
![]() The intermediate-term trend has been UP since Dec 9th, 2025 at 695.95
The intermediate-term trend has been UP since Dec 9th, 2025 at 695.95
![]() The short-term trend has been UP since Dec 18th, 2025 at 711.19
The short-term trend has been UP since Dec 18th, 2025 at 711.19
Smart Scan Analysis for SPDUKMUP
Based on our trend formula, SPDUKMUP is rated as a +90 on a scale from -100 (Strong Downtrend) to +100 (Strong Uptrend).
| Open | High | Low | Price | Change |
|---|---|---|---|---|
| 711.44 | 717.03 | 710.51 | 715.47 | +4.08 |
| Prev. Close | Volume | Bid | Ask | Time |
| 711.39 | 0 | 2025-12-19 17:46:57 |