Index Trend Analysis Report
Prepared for you on Saturday, March 21, 2026.
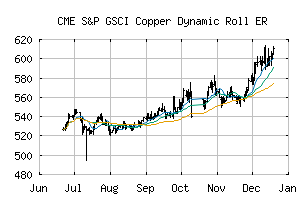
S&P GSCI Copper Dynamic Roll ER (CME:SPDYICP)
Crossroads (-60) - SPDYICP is struggling to move into a solid trend. Beware of choppy markets and consider a sidelines position until a stronger trend is identified.
Is it time to buy, sell, or avoid SPDYICP?
MarketClub looks at technical strength and momentum to determine if the timing is right for SPDYICP.
Learn more about the Trade Triangles and how we make technical analysis as easy as buy and sell.
|
|||||||||||||||
|
|||||||||||||||
MarketClub’s Trade Triangles for SPDYICP
![]() The long-term trend has been UP since Jul 1st, 2025 at 543.10
The long-term trend has been UP since Jul 1st, 2025 at 543.10
![]() The intermediate-term trend has been DOWN since Mar 8th, 2026 at 655.53
The intermediate-term trend has been DOWN since Mar 8th, 2026 at 655.53
![]() The short-term trend has been DOWN since Mar 13th, 2026 at 672.28
The short-term trend has been DOWN since Mar 13th, 2026 at 672.28
Smart Scan Analysis for SPDYICP
Based on our trend formula, SPDYICP is rated as a -60 on a scale from -100 (Strong Downtrend) to +100 (Strong Uptrend).
| Open | High | Low | Price | Change |
|---|---|---|---|---|
| 640.97 | 641.77 | 618.81 | 620.23 | -20.56 |
| Prev. Close | Volume | Bid | Ask | Time |
| 622.00 | 0 | 2026-03-20 13:15:03 |