Index Trend Analysis Report
Prepared for you on Friday, May 9, 2025.
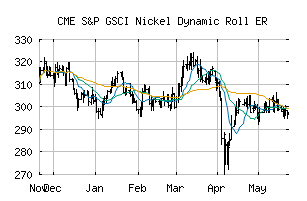
S&P GSCI Nickel Dynamic Roll ER (CME:SPDYIKP)
Long-Term Downtrend (-90) - SPDYIKP is in a strong downtrend that is likely to continue. While SPDYIKP is showing intraday strength, it remains in the confines of a bearish trend. Traders should use caution and set stops.
Is it time to buy, sell, or avoid SPDYIKP?
MarketClub looks at technical strength and momentum to determine if the timing is right for SPDYIKP.
Learn more about the Trade Triangles and how we make technical analysis as easy as buy and sell.
|
|||||||||||||||
|
|||||||||||||||
MarketClub’s Trade Triangles for SPDYIKP
![]() The long-term trend has been DOWN since Apr 4th, 2025 at 294.73
The long-term trend has been DOWN since Apr 4th, 2025 at 294.73
![]() The intermediate-term trend has been DOWN since Mar 31st, 2025 at 310.16
The intermediate-term trend has been DOWN since Mar 31st, 2025 at 310.16
![]() The short-term trend has been DOWN since May 7th, 2025 at 297.57
The short-term trend has been DOWN since May 7th, 2025 at 297.57
Smart Scan Analysis for SPDYIKP
Based on our trend formula, SPDYIKP is rated as a -90 on a scale from -100 (Strong Downtrend) to +100 (Strong Uptrend).
| Open | High | Low | Price | Change |
|---|---|---|---|---|
| 297.74 | 298.19 | 297.56 | 298.19 | +0.36 |
| Prev. Close | Volume | Bid | Ask | Time |
| 297.83 | 0 | 2025-05-09 01:32:33 |
| 52wk High | 389.5102 | 52wk High Date | 2018-04-19 |
| 52wk Low | 247.602 | 52wk Low Date | 2018-11-27 |