Index Trend Analysis Report
Prepared for you on Wednesday, July 30, 2025.
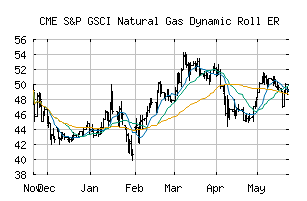
S&P GSCI Natural Gas Dynamic Roll ER (CME:SPDYNGP)
Long-Term Downtrend (-90) - SPDYNGP is in a strong downtrend that is likely to continue. While SPDYNGP is showing intraday strength, it remains in the confines of a bearish trend. Traders should use caution and set stops.
Is it time to buy, sell, or avoid SPDYNGP?
MarketClub looks at technical strength and momentum to determine if the timing is right for SPDYNGP.
Learn more about the Trade Triangles and how we make technical analysis as easy as buy and sell.
|
|||||||||||||||
|
|||||||||||||||
MarketClub’s Trade Triangles for SPDYNGP
![]() The long-term trend has been DOWN since Jul 25th, 2025 at 44.385
The long-term trend has been DOWN since Jul 25th, 2025 at 44.385
![]() The intermediate-term trend has been DOWN since Jun 30th, 2025 at 48.489
The intermediate-term trend has been DOWN since Jun 30th, 2025 at 48.489
![]() The short-term trend has been DOWN since Jul 17th, 2025 at 48.442
The short-term trend has been DOWN since Jul 17th, 2025 at 48.442
Smart Scan Analysis for SPDYNGP
Based on our trend formula, SPDYNGP is rated as a -90 on a scale from -100 (Strong Downtrend) to +100 (Strong Uptrend).
| Open | High | Low | Price | Change |
|---|---|---|---|---|
| 44.338 | 44.735 | 43.426 | 43.835 | -0.503 |
| Prev. Close | Volume | Bid | Ask | Time |
| 44.338 | 0 | 2025-07-30 12:15:43 |
| 52wk High | 90.0159 | 52wk High Date | 2018-11-19 |
| 52wk Low | 72.0656 | 52wk Low Date | 2017-12-21 |