Index Trend Analysis Report
Prepared for you on Sunday, April 12, 2026.
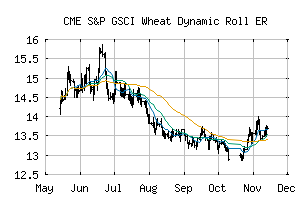
S&P GSCI Wheat Dynamic Roll ER (CME:SPDYWHP)
Weak Downtrend (-65) - SPDYWHP is showing signs of a strengthening downtrend. Monitor SPDYWHP as it may be building momentum to the downside.
Is it time to buy, sell, or avoid SPDYWHP?
MarketClub looks at technical strength and momentum to determine if the timing is right for SPDYWHP.
Learn more about the Trade Triangles and how we make technical analysis as easy as buy and sell.
|
|||||||||||||||
|
|||||||||||||||
MarketClub’s Trade Triangles for SPDYWHP
![]() The long-term trend has been UP since Feb 20th, 2026 at 13.991
The long-term trend has been UP since Feb 20th, 2026 at 13.991
![]() The intermediate-term trend has been DOWN since Apr 7th, 2026 at 14.128
The intermediate-term trend has been DOWN since Apr 7th, 2026 at 14.128
![]() The short-term trend has been DOWN since Apr 1st, 2026 at 14.571
The short-term trend has been DOWN since Apr 1st, 2026 at 14.571
Smart Scan Analysis for SPDYWHP
Based on our trend formula, SPDYWHP is rated as a -70 on a scale from -100 (Strong Downtrend) to +100 (Strong Uptrend).
| Open | High | Low | Price | Change |
|---|---|---|---|---|
| 14.003 | 14.051 | 13.818 | 13.859 | -0.156 |
| Prev. Close | Volume | Bid | Ask | Time |
| 13.889 | 0 | 2026-04-10 14:29:48 |