Index Trend Analysis Report
Prepared for you on Wednesday, July 30, 2025.
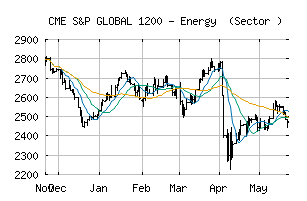
S&P GLOBAL 1200 - Energy (Sector ) (CME:SPG1200-10)
Crossroads (+60) - SPG1200-10 is struggling to move into a solid trend. Beware of choppy markets and consider a sidelines position until a stronger trend is identified.
Is it time to buy, sell, or avoid SPG1200-10?
MarketClub looks at technical strength and momentum to determine if the timing is right for SPG1200-10.
Learn more about the Trade Triangles and how we make technical analysis as easy as buy and sell.
|
|||||||||||||||
|
|||||||||||||||
MarketClub’s Trade Triangles for SPG1200-10
![]() The long-term trend has been DOWN since Apr 4th, 2025 at 2494.13
The long-term trend has been DOWN since Apr 4th, 2025 at 2494.13
![]() The intermediate-term trend has been UP since Apr 28th, 2025 at 2499.59
The intermediate-term trend has been UP since Apr 28th, 2025 at 2499.59
![]() The short-term trend has been UP since Jul 23rd, 2025 at 2633.45
The short-term trend has been UP since Jul 23rd, 2025 at 2633.45
Smart Scan Analysis for SPG1200-10
Based on our trend formula, SPG1200-10 is rated as a +60 on a scale from -100 (Strong Downtrend) to +100 (Strong Uptrend).
| Open | High | Low | Price | Change |
|---|---|---|---|---|
| 2704.02 | 2710.09 | 2700.19 | 2700.48 | -4.13 |
| Prev. Close | Volume | Bid | Ask | Time |
| 2704.61 | 0 | 2025-07-30 07:11:00 |
| 52wk High | 2531.09 | 52wk High Date | 2018-05-22 |
| 52wk Low | 2056.07 | 52wk Low Date | 2018-11-23 |