Index Trend Analysis Report
Prepared for you on Thursday, April 2, 2026.
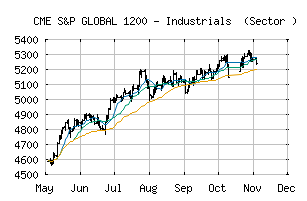
S&P GLOBAL 1200 - Industrials (Sector ) (CME:SPG1200-20)
Bull Market Weakness (+75) - SPG1200-20 is showing signs of short-term weakness, but still remains in the confines of a long-term uptrend. Keep an eye on SPG1200-20 as it may be in the beginning stages of a reversal.
Is it time to buy, sell, or avoid SPG1200-20?
MarketClub looks at technical strength and momentum to determine if the timing is right for SPG1200-20.
Learn more about the Trade Triangles and how we make technical analysis as easy as buy and sell.
|
|||||||||||||||
|
|||||||||||||||
MarketClub’s Trade Triangles for SPG1200-20
![]() The long-term trend has been UP since May 2nd, 2025 at 4579.16
The long-term trend has been UP since May 2nd, 2025 at 4579.16
![]() The intermediate-term trend has been DOWN since Mar 3rd, 2026 at 5861.82
The intermediate-term trend has been DOWN since Mar 3rd, 2026 at 5861.82
![]() The short-term trend has been UP since Apr 1st, 2026 at 5475.53
The short-term trend has been UP since Apr 1st, 2026 at 5475.53
Smart Scan Analysis for SPG1200-20
Based on our trend formula, SPG1200-20 is rated as a +75 on a scale from -100 (Strong Downtrend) to +100 (Strong Uptrend).
| Open | High | Low | Price | Change |
|---|---|---|---|---|
| 5571.56 | 5588.37 | 5467.49 | 5560.77 | -12.55 |
| Prev. Close | Volume | Bid | Ask | Time |
| 5573.32 | 0 | 2026-04-02 21:22:00 |
| 52wk High | 2953.65 | 52wk High Date | 2018-01-29 |
| 52wk Low | 2419.37 | 52wk Low Date | 2018-10-29 |