Index Trend Analysis Report
Prepared for you on Tuesday, March 31, 2026.
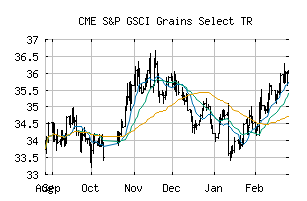
S&P GSCI Grains Select TR (CME:SPGSGSLT)
Weak Uptrend (+65) - SPGSGSLT is showing signs of weakening momentum to the upside. Monitor SPGSGSLT as it may be in the beginning stages of a reversal.
Is it time to buy, sell, or avoid SPGSGSLT?
MarketClub looks at technical strength and momentum to determine if the timing is right for SPGSGSLT.
Learn more about the Trade Triangles and how we make technical analysis as easy as buy and sell.
|
|||||||||||||||
|
|||||||||||||||
MarketClub’s Trade Triangles for SPGSGSLT
![]() The long-term trend has been UP since Nov 2nd, 2025 at 35.742
The long-term trend has been UP since Nov 2nd, 2025 at 35.742
![]() The intermediate-term trend has been UP since Feb 4th, 2026 at 35.116
The intermediate-term trend has been UP since Feb 4th, 2026 at 35.116
![]() The short-term trend has been DOWN since Mar 30th, 2026 at 37.155
The short-term trend has been DOWN since Mar 30th, 2026 at 37.155
Smart Scan Analysis for SPGSGSLT
Based on our trend formula, SPGSGSLT is rated as a +65 on a scale from -100 (Strong Downtrend) to +100 (Strong Uptrend).
| Open | High | Low | Price | Change |
|---|---|---|---|---|
| 37.183 | 37.675 | 37.035 | 37.439 | +0.313 |
| Prev. Close | Volume | Bid | Ask | Time |
| 37.126 | 0 | 2026-03-31 15:49:00 |