Index Trend Analysis Report
Prepared for you on Friday, March 13, 2026.
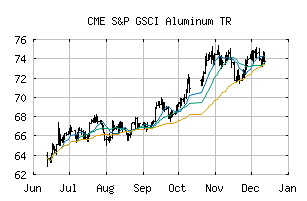
S&P GSCI Aluminum TR (CME:SPGSIATR)
Long-Term Uptrend (+90) - SPGSIATR is in a strong uptrend that is likely to continue. While SPGSIATR is showing intraday weakness, it remains in the confines of a bullish trend. Traders should use caution and utilize a stop order.
Is it time to buy, sell, or avoid SPGSIATR?
MarketClub looks at technical strength and momentum to determine if the timing is right for SPGSIATR.
Learn more about the Trade Triangles and how we make technical analysis as easy as buy and sell.
|
|||||||||||||||
|
|||||||||||||||
MarketClub’s Trade Triangles for SPGSIATR
![]() The long-term trend has been UP since Jul 20th, 2025 at 67.443
The long-term trend has been UP since Jul 20th, 2025 at 67.443
![]() The intermediate-term trend has been UP since Feb 25th, 2026 at 81.593
The intermediate-term trend has been UP since Feb 25th, 2026 at 81.593
![]() The short-term trend has been UP since Feb 20th, 2026 at 79.867
The short-term trend has been UP since Feb 20th, 2026 at 79.867
Smart Scan Analysis for SPGSIATR
Based on our trend formula, SPGSIATR is rated as a +90 on a scale from -100 (Strong Downtrend) to +100 (Strong Uptrend).
| Open | High | Low | Price | Change |
|---|---|---|---|---|
| 91.633 | 91.646 | 90.437 | 90.502 | -1.040 |
| Prev. Close | Volume | Bid | Ask | Time |
| 91.542 | 0 | 2026-03-13 04:22:00 |
| 52wk High | 77.31486 | 52wk High Date | 2018-04-19 |
| 52wk Low | 54.57319 | 52wk Low Date | 2018-11-28 |