Index Trend Analysis Report
Prepared for you on Thursday, March 26, 2026.
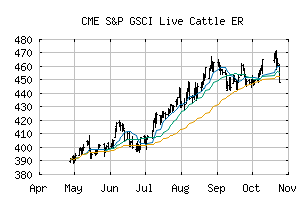
S&P GSCI Live Cattle ER (CME:SPGSLCP)
Weak Uptrend (+65) - SPGSLCP is showing signs of weakening momentum to the upside. Monitor SPGSLCP as it may be in the beginning stages of a reversal.
Is it time to buy, sell, or avoid SPGSLCP?
MarketClub looks at technical strength and momentum to determine if the timing is right for SPGSLCP.
Learn more about the Trade Triangles and how we make technical analysis as easy as buy and sell.
|
|||||||||||||||
|
|||||||||||||||
MarketClub’s Trade Triangles for SPGSLCP
![]() The long-term trend has been UP since Feb 2nd, 2026 at 458.37
The long-term trend has been UP since Feb 2nd, 2026 at 458.37
![]() The intermediate-term trend has been DOWN since Feb 27th, 2026 at 448.48
The intermediate-term trend has been DOWN since Feb 27th, 2026 at 448.48
![]() The short-term trend has been UP since Mar 13th, 2026 at 445.88
The short-term trend has been UP since Mar 13th, 2026 at 445.88
Smart Scan Analysis for SPGSLCP
Based on our trend formula, SPGSLCP is rated as a +65 on a scale from -100 (Strong Downtrend) to +100 (Strong Uptrend).
| Open | High | Low | Price | Change |
|---|---|---|---|---|
| 453.24 | 455.70 | 449.04 | 451.65 | -1.59 |
| Prev. Close | Volume | Bid | Ask | Time |
| 451.79 | 0 | 2026-03-25 14:10:00 |
| 52wk High | 369.5444 | 52wk High Date | 2017-11-30 |
| 52wk Low | 299.2304 | 52wk Low Date | 2018-04-04 |