Index Trend Analysis Report
Prepared for you on Thursday, April 9, 2026.
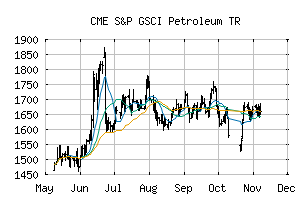
S&P GSCI Petroleum TR (CME:SPGSPTTR)
Weak Uptrend (+65) - SPGSPTTR is showing signs of weakening momentum to the upside. Monitor SPGSPTTR as it may be in the beginning stages of a reversal.
Is it time to buy, sell, or avoid SPGSPTTR?
MarketClub looks at technical strength and momentum to determine if the timing is right for SPGSPTTR.
Learn more about the Trade Triangles and how we make technical analysis as easy as buy and sell.
|
|||||||||||||||
|
|||||||||||||||
MarketClub’s Trade Triangles for SPGSPTTR
![]() The long-term trend has been UP since Jan 14th, 2026 at 1709.12
The long-term trend has been UP since Jan 14th, 2026 at 1709.12
![]() The intermediate-term trend has been UP since Jan 9th, 2026 at 1612.40
The intermediate-term trend has been UP since Jan 9th, 2026 at 1612.40
![]() The short-term trend has been DOWN since Apr 7th, 2026 at 3094.70
The short-term trend has been DOWN since Apr 7th, 2026 at 3094.70
Smart Scan Analysis for SPGSPTTR
Based on our trend formula, SPGSPTTR is rated as a +65 on a scale from -100 (Strong Downtrend) to +100 (Strong Uptrend).
| Open | High | Low | Price | Change |
|---|---|---|---|---|
| 2829.77 | 2876.81 | 2827.22 | 2872.49 | +49.44 |
| Prev. Close | Volume | Bid | Ask | Time |
| 2823.05 | 0 | 2026-04-09 05:00:00 |
| 52wk High | 1423.784 | 52wk High Date | 2018-10-03 |
| 52wk Low | 951.933 | 52wk Low Date | 2018-11-29 |