Index Trend Analysis Report
Prepared for you on Friday, July 11, 2025.
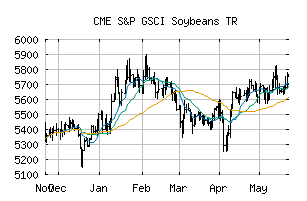
S&P GSCI Soybeans TR (CME:SPGSSOTR)
Weak Downtrend (-65) - SPGSSOTR is showing signs of a strengthening downtrend. Monitor SPGSSOTR as it may be building momentum to the downside.
Is it time to buy, sell, or avoid SPGSSOTR?
MarketClub looks at technical strength and momentum to determine if the timing is right for SPGSSOTR.
Learn more about the Trade Triangles and how we make technical analysis as easy as buy and sell.
|
|||||||||||||||
|
|||||||||||||||
MarketClub’s Trade Triangles for SPGSSOTR
![]() The long-term trend has been UP since Jun 15th, 2025 at 5823.91
The long-term trend has been UP since Jun 15th, 2025 at 5823.91
![]() The intermediate-term trend has been DOWN since Jul 9th, 2025 at 5598.73
The intermediate-term trend has been DOWN since Jul 9th, 2025 at 5598.73
![]() The short-term trend has been DOWN since Jul 7th, 2025 at 5669.74
The short-term trend has been DOWN since Jul 7th, 2025 at 5669.74
Smart Scan Analysis for SPGSSOTR
Based on our trend formula, SPGSSOTR is rated as a -70 on a scale from -100 (Strong Downtrend) to +100 (Strong Uptrend).
| Open | High | Low | Price | Change |
|---|---|---|---|---|
| 5614.92 | 5623.22 | 5556.81 | 5576.18 | -37.36 |
| Prev. Close | Volume | Bid | Ask | Time |
| 5613.54 | 0 | 2025-07-11 14:27:00 |
| 52wk High | 4609.802 | 52wk High Date | 2018-03-02 |
| 52wk Low | 3386.417 | 52wk Low Date | 2018-09-18 |