Index Trend Analysis Report
Prepared for you on Wednesday, July 30, 2025.
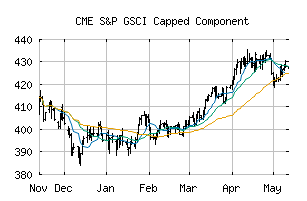
S&P GSCI Capped Component (CME:SPGSUC)
Weak Uptrend (+65) - SPGSUC is showing signs of weakening momentum to the upside. Monitor SPGSUC as it may be in the beginning stages of a reversal.
Is it time to buy, sell, or avoid SPGSUC?
MarketClub looks at technical strength and momentum to determine if the timing is right for SPGSUC.
Learn more about the Trade Triangles and how we make technical analysis as easy as buy and sell.
|
|||||||||||||||
|
|||||||||||||||
MarketClub’s Trade Triangles for SPGSUC
![]() The long-term trend has been UP since Jun 12th, 2025 at 440.29
The long-term trend has been UP since Jun 12th, 2025 at 440.29
![]() The intermediate-term trend has been DOWN since Jun 30th, 2025 at 423.16
The intermediate-term trend has been DOWN since Jun 30th, 2025 at 423.16
![]() The short-term trend has been UP since Jul 29th, 2025 at 427.84
The short-term trend has been UP since Jul 29th, 2025 at 427.84
Smart Scan Analysis for SPGSUC
Based on our trend formula, SPGSUC is rated as a +65 on a scale from -100 (Strong Downtrend) to +100 (Strong Uptrend).
| Open | High | Low | Price | Change |
|---|---|---|---|---|
| 430.41 | 431.25 | 428.99 | 429.09 | -0.88 |
| Prev. Close | Volume | Bid | Ask | Time |
| 429.97 | 0 | 2025-07-30 06:09:00 |
| 52wk High | 316.2658 | 52wk High Date | 2018-05-22 |
| 52wk Low | 275.5229 | 52wk Low Date | 2017-12-14 |