Index Trend Analysis Report
Prepared for you on Wednesday, July 30, 2025.
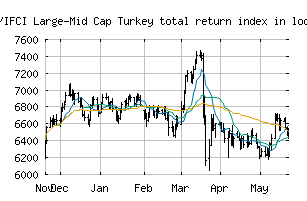
S&P/IFCI Large-Mid Cap Turkey total return index in local currency (CME:SPITRXLT)
Countertrend Up (+85) - SPITRXLT is showing short-term weakness. However, look for the longer-term bullish trend to resume. As always, continue to monitor the trend score and utilize a stop order.
Is it time to buy, sell, or avoid SPITRXLT?
MarketClub looks at technical strength and momentum to determine if the timing is right for SPITRXLT.
Learn more about the Trade Triangles and how we make technical analysis as easy as buy and sell.
|
|||||||||||||||
|
|||||||||||||||
MarketClub’s Trade Triangles for SPITRXLT
![]() The long-term trend has been UP since Jul 1st, 2025 at 6934.66
The long-term trend has been UP since Jul 1st, 2025 at 6934.66
![]() The intermediate-term trend has been UP since Jun 10th, 2025 at 6672.92
The intermediate-term trend has been UP since Jun 10th, 2025 at 6672.92
![]() The short-term trend has been DOWN since Jul 28th, 2025 at 7326.52
The short-term trend has been DOWN since Jul 28th, 2025 at 7326.52
Smart Scan Analysis for SPITRXLT
Based on our trend formula, SPITRXLT is rated as a +85 on a scale from -100 (Strong Downtrend) to +100 (Strong Uptrend).
| Open | High | Low | Price | Change |
|---|---|---|---|---|
| 7276.18 | 7415.00 | 7267.53 | 7379.37 | +96.73 |
| Prev. Close | Volume | Bid | Ask | Time |
| 7282.64 | 0 | 2025-07-30 11:40:52 |
| 52wk High | 752.76 | 52wk High Date | 2018-01-29 |
| 52wk Low | 529.78 | 52wk Low Date | 2018-08-17 |