Index Trend Analysis Report
Prepared for you on Tuesday, February 3, 2026.
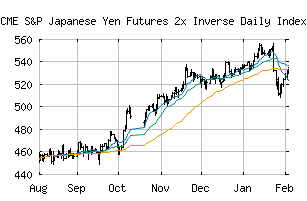
S&P Japanese Yen Futures 2x Inverse Daily Index TR (CME:SPJYFT2I)
Sidelines Mode (+55) - SPJYFT2I is moving in a sideways pattern and is unable to gain momentum in either direction. Beware of choppy movement and consider a sidelines position until a stronger trend is identified.
Is it time to buy, sell, or avoid SPJYFT2I?
MarketClub looks at technical strength and momentum to determine if the timing is right for SPJYFT2I.
Learn more about the Trade Triangles and how we make technical analysis as easy as buy and sell.
|
|||||||||||||||
|
|||||||||||||||
MarketClub’s Trade Triangles for SPJYFT2I
![]() The long-term trend has been UP since Jul 15th, 2025 at 460.60
The long-term trend has been UP since Jul 15th, 2025 at 460.60
![]() The intermediate-term trend has been DOWN since Jan 25th, 2026 at 531.40
The intermediate-term trend has been DOWN since Jan 25th, 2026 at 531.40
![]() The short-term trend has been UP since Feb 1st, 2026 at 525.55
The short-term trend has been UP since Feb 1st, 2026 at 525.55
Smart Scan Analysis for SPJYFT2I
Based on our trend formula, SPJYFT2I is rated as a +55 on a scale from -100 (Strong Downtrend) to +100 (Strong Uptrend).
| Open | High | Low | Price | Change |
|---|---|---|---|---|
| 530.29 | 534.90 | 529.63 | 533.80 | +4.01 |
| Prev. Close | Volume | Bid | Ask | Time |
| 529.79 | 0 | 2026-02-03 19:28:25 |