Index Trend Analysis Report
Prepared for you on Wednesday, July 30, 2025.
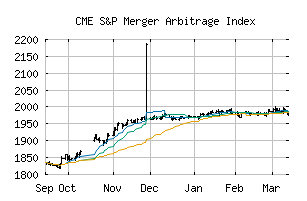
S&P Merger Arbitrage Index (CME:SPLSAUP)
Bull Market Weakness (+75) - SPLSAUP is showing signs of short-term weakness, but still remains in the confines of a long-term uptrend. Keep an eye on SPLSAUP as it may be in the beginning stages of a reversal.
Is it time to buy, sell, or avoid SPLSAUP?
MarketClub looks at technical strength and momentum to determine if the timing is right for SPLSAUP.
Learn more about the Trade Triangles and how we make technical analysis as easy as buy and sell.
|
|||||||||||||||
|
|||||||||||||||
MarketClub’s Trade Triangles for SPLSAUP
![]() The long-term trend has been UP since Jul 10th, 2025 at 1800.21
The long-term trend has been UP since Jul 10th, 2025 at 1800.21
![]() The intermediate-term trend has been UP since Jul 10th, 2025 at 1800.21
The intermediate-term trend has been UP since Jul 10th, 2025 at 1800.21
![]() The short-term trend has been DOWN since Jul 29th, 2025 at 1810.21
The short-term trend has been DOWN since Jul 29th, 2025 at 1810.21
Smart Scan Analysis for SPLSAUP
Based on our trend formula, SPLSAUP is rated as a +75 on a scale from -100 (Strong Downtrend) to +100 (Strong Uptrend).
| Open | High | Low | Price | Change |
|---|---|---|---|---|
| 1811.84 | 1813.23 | 1808.80 | 1809.46 | -2.49 |
| Prev. Close | Volume | Bid | Ask | Time |
| 1811.95 | 0 | 2025-07-30 16:19:52 |