Index Trend Analysis Report
Prepared for you on Tuesday, June 17, 2025.
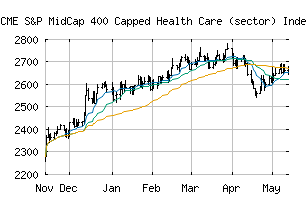
S&P MidCap 400 Capped Health Care (sector) Index TR (CME:SPMU4HCT)
Weak Downtrend (-65) - SPMU4HCT is showing signs of a strengthening downtrend. Monitor SPMU4HCT as it may be building momentum to the downside.
Is it time to buy, sell, or avoid SPMU4HCT?
MarketClub looks at technical strength and momentum to determine if the timing is right for SPMU4HCT.
Learn more about the Trade Triangles and how we make technical analysis as easy as buy and sell.
|
|||||||||||||||
|
|||||||||||||||
MarketClub’s Trade Triangles for SPMU4HCT
![]() The long-term trend has been DOWN since Nov 18th, 2024 at 2691.39
The long-term trend has been DOWN since Nov 18th, 2024 at 2691.39
![]() The intermediate-term trend has been UP since Apr 28th, 2025 at 2406.10
The intermediate-term trend has been UP since Apr 28th, 2025 at 2406.10
![]() The short-term trend has been DOWN since Jun 11th, 2025 at 2488.98
The short-term trend has been DOWN since Jun 11th, 2025 at 2488.98
Smart Scan Analysis for SPMU4HCT
Based on our trend formula, SPMU4HCT is rated as a -65 on a scale from -100 (Strong Downtrend) to +100 (Strong Uptrend).
| Open | High | Low | Price | Change |
|---|---|---|---|---|
| 2465.41 | 2483.45 | 2448.82 | 2471.87 | +6.51 |
| Prev. Close | Volume | Bid | Ask | Time |
| 2471.87 | 0 | 2025-06-16 16:19:28 |