Index Trend Analysis Report
Prepared for you on Friday, May 9, 2025.
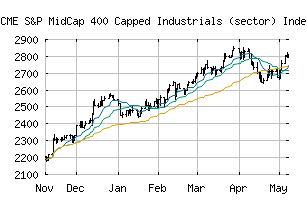
S&P MidCap 400 Capped Industrials (sector) Index TR (CME:SPMU4IT)
Crossroads (+60) - SPMU4IT is struggling to move into a solid trend. Beware of choppy markets and consider a sidelines position until a stronger trend is identified.
Is it time to buy, sell, or avoid SPMU4IT?
MarketClub looks at technical strength and momentum to determine if the timing is right for SPMU4IT.
Learn more about the Trade Triangles and how we make technical analysis as easy as buy and sell.
|
|||||||||||||||
|
|||||||||||||||
MarketClub’s Trade Triangles for SPMU4IT
![]() The long-term trend has been DOWN since Feb 21st, 2025 at 2856.67
The long-term trend has been DOWN since Feb 21st, 2025 at 2856.67
![]() The intermediate-term trend has been UP since Apr 28th, 2025 at 2644.20
The intermediate-term trend has been UP since Apr 28th, 2025 at 2644.20
![]() The short-term trend has been UP since May 1st, 2025 at 2646.99
The short-term trend has been UP since May 1st, 2025 at 2646.99
Smart Scan Analysis for SPMU4IT
Based on our trend formula, SPMU4IT is rated as a +60 on a scale from -100 (Strong Downtrend) to +100 (Strong Uptrend).
| Open | High | Low | Price | Change |
|---|---|---|---|---|
| 2704.58 | 2795.93 | 2704.58 | 2770.56 | +65.98 |
| Prev. Close | Volume | Bid | Ask | Time |
| 2770.56 | 0 | 2025-05-08 16:19:18 |